CD Squared or (Crossdressing)2
I guess that’s one of the problems of being a mathematics teacher. You tend to think of everything in terms of equations, formulae, charts and graphs.
My afternoon class had finished some ten minutes earlier and, apart from a few stragglers, the students had all but just about departed. I checked my watch and saw that I had quite some time to kill until I met Claire for our Tuesday night out with the “girls,”
We were planning to dress together at my apartment and take one car to the CD group’s meeting place. Unfortunately, Claire’s wife was having a spell of not being happy about her crossdressing, so I’d agreed that Claire could keep her clothes and accessories at mine until things improved.
I really must put together an article for TGForum, I thought, as I sat staring into space. It’s been quite a while since I made any written contribution. I glanced at my watch again, Hmm… well, I’ve got an hour, I guess. Maybe I should start something now?
I took a fresh piece of paper from my desk and decided I’d write the draft in pencil. For a few minutes I sat at my desk, with my right elbow on the desk top and my chin resting in the palm of my hand. Nothing. I tapped the pencil on the table with my left hand, but still nothing.
Idly, I started turning the pages of the maths text book on my desk, reflecting on what I’d been teaching only twenty or so minutes before.
Aha! I exclaimed, suddenly, I’ve got it. The last student was just about to leave and she looked back at me as she heard my exclamation. Although she gave me a quizzical look, she simply closed the classroom door and drifted away.
I, firstly, drew a Y axis and an X axis on the paper. The Y axis I labelled “intensity” and the X axis I labelled “age.”
“Hmm…. no that’s not quite right,” I thought, so I erased the Y label.
Whilst I was thinking, I reached for my briefcase and pulled out a half-finished bottle of orange juice which I’d started to drink at lunchtime. Taking a swig, I thought, I know, I think I’ll do a bar chart.
For another minute or so I doodled around the top edge of the paper and then, with sudden inspiration, I had what I thought was a great idea.
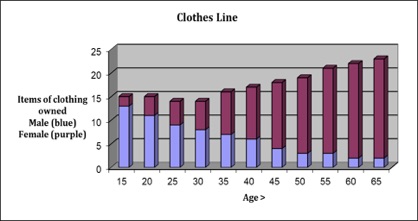
On the Y axis I marked numbers from 0 up to 25, with the labels “Items of clothing owned” together with “Male (blue)” and “Female (purple).” On the X axis I also marked numbers, this time from 15 to 65, and a label saying “Age >.”
I drew in the bars in each column, separating the colors in accordance with the label on the Y axis. That’s a cool chart, I thought. The bars demonstrate the situation really well. I’ll call it ‘Clothes line!’
Note: the graph shows, the older you get, how the ratio of male to female clothes you own reduces and the female items increases!
Now for a second one. The second graph was easier to do, as the idea just came to me instantly. Within a few minutes I’d drawn the axes and labelled them. I wrote “Visits (to the therapist)/intake (of medicinal compounds) (pink)” on the Y axis, followed by “Desire to change back to drab (blue).”
Underneath “Age >” on the X axis, I also wrote the numbers “15-65.”
15 seems a good enough place to start, I mused and then leaned back in my chair, quite pleased with myself. Although nowadays you hear of some many youngsters of around 8-10 querying their gender. On the other hand, by 65 you’ve well and truly on an established pathway.
I tilted my head to one side, then the other, and looked at the newly created framework of the graph again. Then I drew two lines, one rising from the left to right and the other falling from high on the left of the graph to the lower right. They intersected almost in the middle.
Great, that’s it, I thought. Perfect. I think I’ll call this chart ‘Diminishing Returns.’ And I’ll put a Legend underneath to explain a bit further.
I smiled to myself.
Note: the graph shows that the older you get the longer you wish to stay en-femme, ie the desire to change back to drab diminishes (blue line). The pink line represents the increasing number of visits to your therapist and the increase in the intake of medicinal compounds to feminize yourself!
For a few moments, I sat and wondered if TGF would accept an article like this, a sort of tongue-in-cheek piece. But, hold on, I am a maths teacher, I thought. And the graphs have basis in fact. Maybe I should try and teach my students the mathematical rudimentaries of being a crossdresser? I smiled to myself.
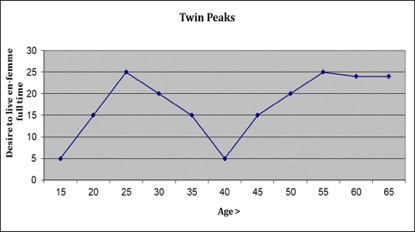
Like a light suddenly being turned on, the idea for the third graph just popped into my head. Ah, yes, the classic, I thought. The Twin peaks! But how do I show them in graph form?
I sketched the axes as before, but mused for a few moments on how to represent what I wanted to show. Up and then down, then up, then… I thought. Then sort of flat, I guess. But the first ‘down’ needs to be very gradual and the second ‘rise’ very steep.
I erased part of the graph line and re-drew it. Yes, that’s much better, much more like it. Now for the labels on the axes.
I labelled Y as “Desire to live en-femme full-time” and X as “Age >” again, with numbers from 15-65 immediately below the X line. Seems like the age factor is really rather important in all this, I thought, as I looked back on the other two graphs I had drawn. Age keeps reappearing!
Note: the graph shows that there are two peaks in your life where the desire to live full time as a female “peaks.” In your mid-20’s before you have family commitments, and in your mid-50’s when your children have grown up and left home and you may no longer be in a relationship.
The more I looked at the graphs I had drawn, the more I realized that there was no need to write any further words to explain them. Any CD or T-girl would immediately understand what these charts/graphs were all about and know the feelings which had prompted me to draw them.
 Just keep things simple. And don’t even try to put any smart equations in the article, no sort of:
“CD + wife = trouble” or
“CD x 2 – 1 = CD alone”
or anything similar,” I thought. Save the equations for the next article.
So, I then I worked out a heading for the article saying “CD squared” or “(Cross Dressing)2” and decided I’d work on putting the graphs into Excel tomorrow night when I had some spare time.
But now it’s time to think about what to wear tonight!
Like to make a comment, or review the math? Login here and use the comment area below.
Category: Transgender Fun & Entertainment, Transgender Opinion


